
Journal · replay · backtest
Import your trades. Replay the market. Test your rules.
A journal that computes pips, R and P&L for each instrument, replays any period candle by candle with the macro context of the time, and tests rules written in plain words on historical data.
Included in Full Access, trial included.
The app, its course and its reports are in French.
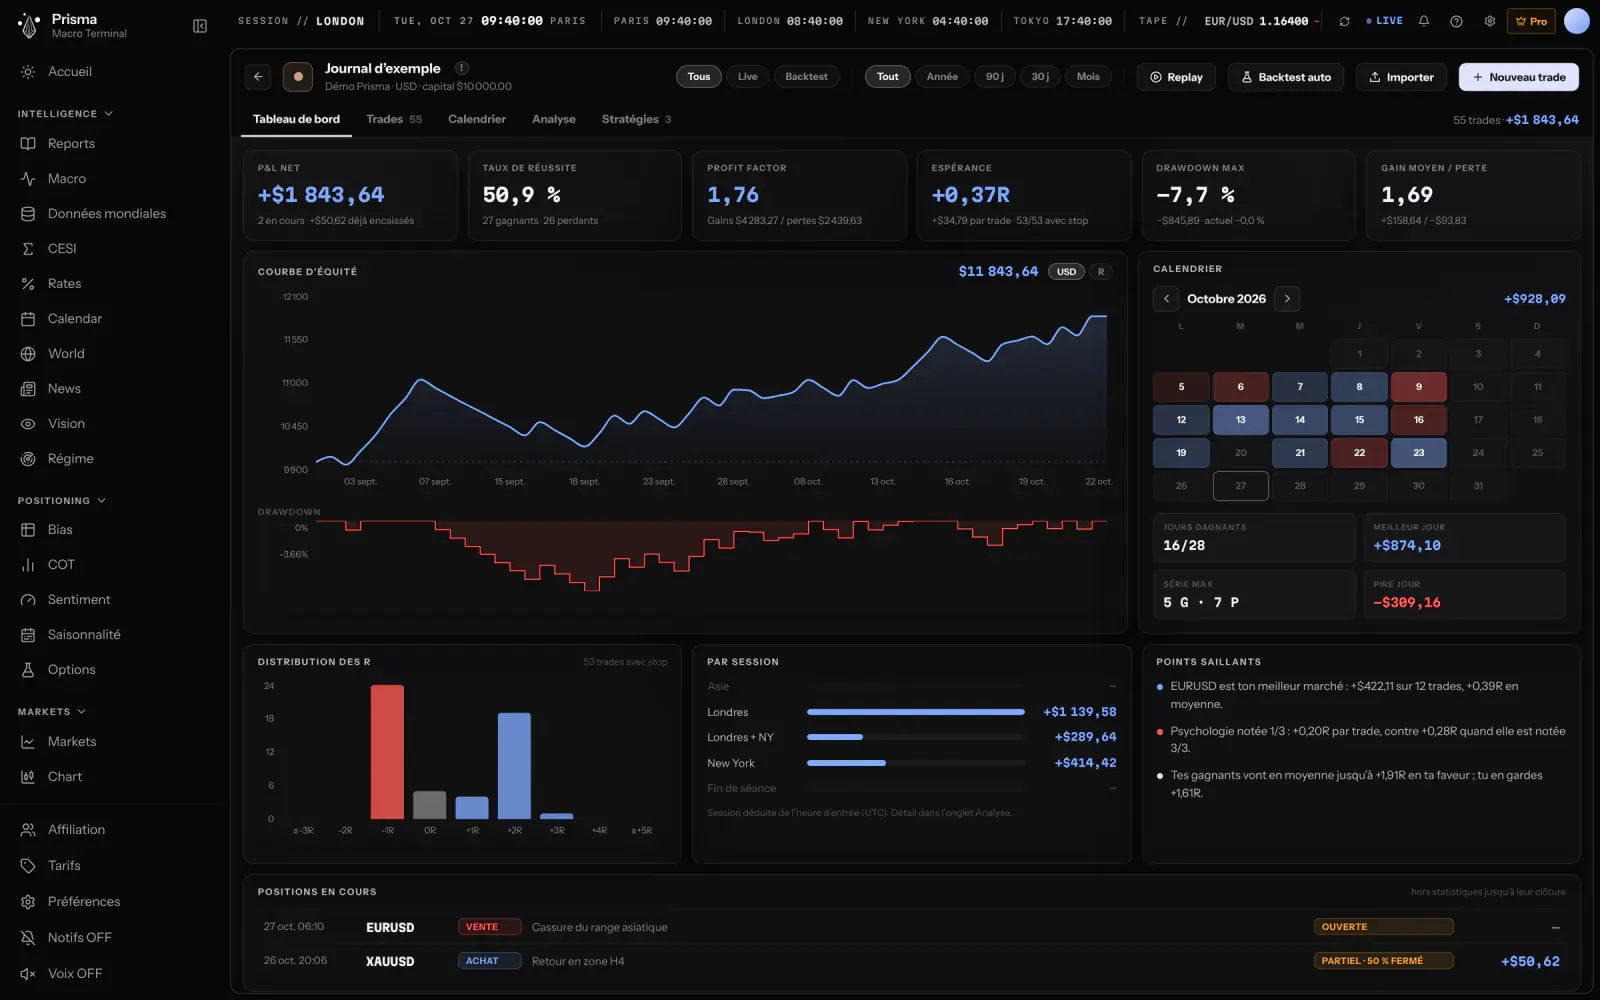 Simulated data
01 / 05 · Import
Your trades, without retyping.
MT5 and MT4 HTML reports, or any CSV (cTrader, TradingView, Excel) with column mapping.
- Partial closes are grouped together.
- MT4/MT5 server times are converted to your time zone.
- The file is read in your browser: only the trades it recognises are sent.
- MT5HTML report
- MT4HTML report
- CSVcTrader, TradingView, Excel
02 / 05 · Read
What your trades teach you.
Dashboard, P&L calendar, distribution of R, sessions. An advanced analysis: Sharpe, Sortino, Calmar, VaR, Ulcer, time under water, plan compliance. For each trade: entry, stop, target, exits, MAE and MFE.
P&L calendar · September 2026
+€1,11412 winning days · 6 losing
By closing day, in euros.

A trade sheet: entry, stop, target, MAE and MFE
MAE: the furthest the price went against you. MFE: the furthest in your favour.
03 / 05 · Replay
Replay any period, candle by candle.
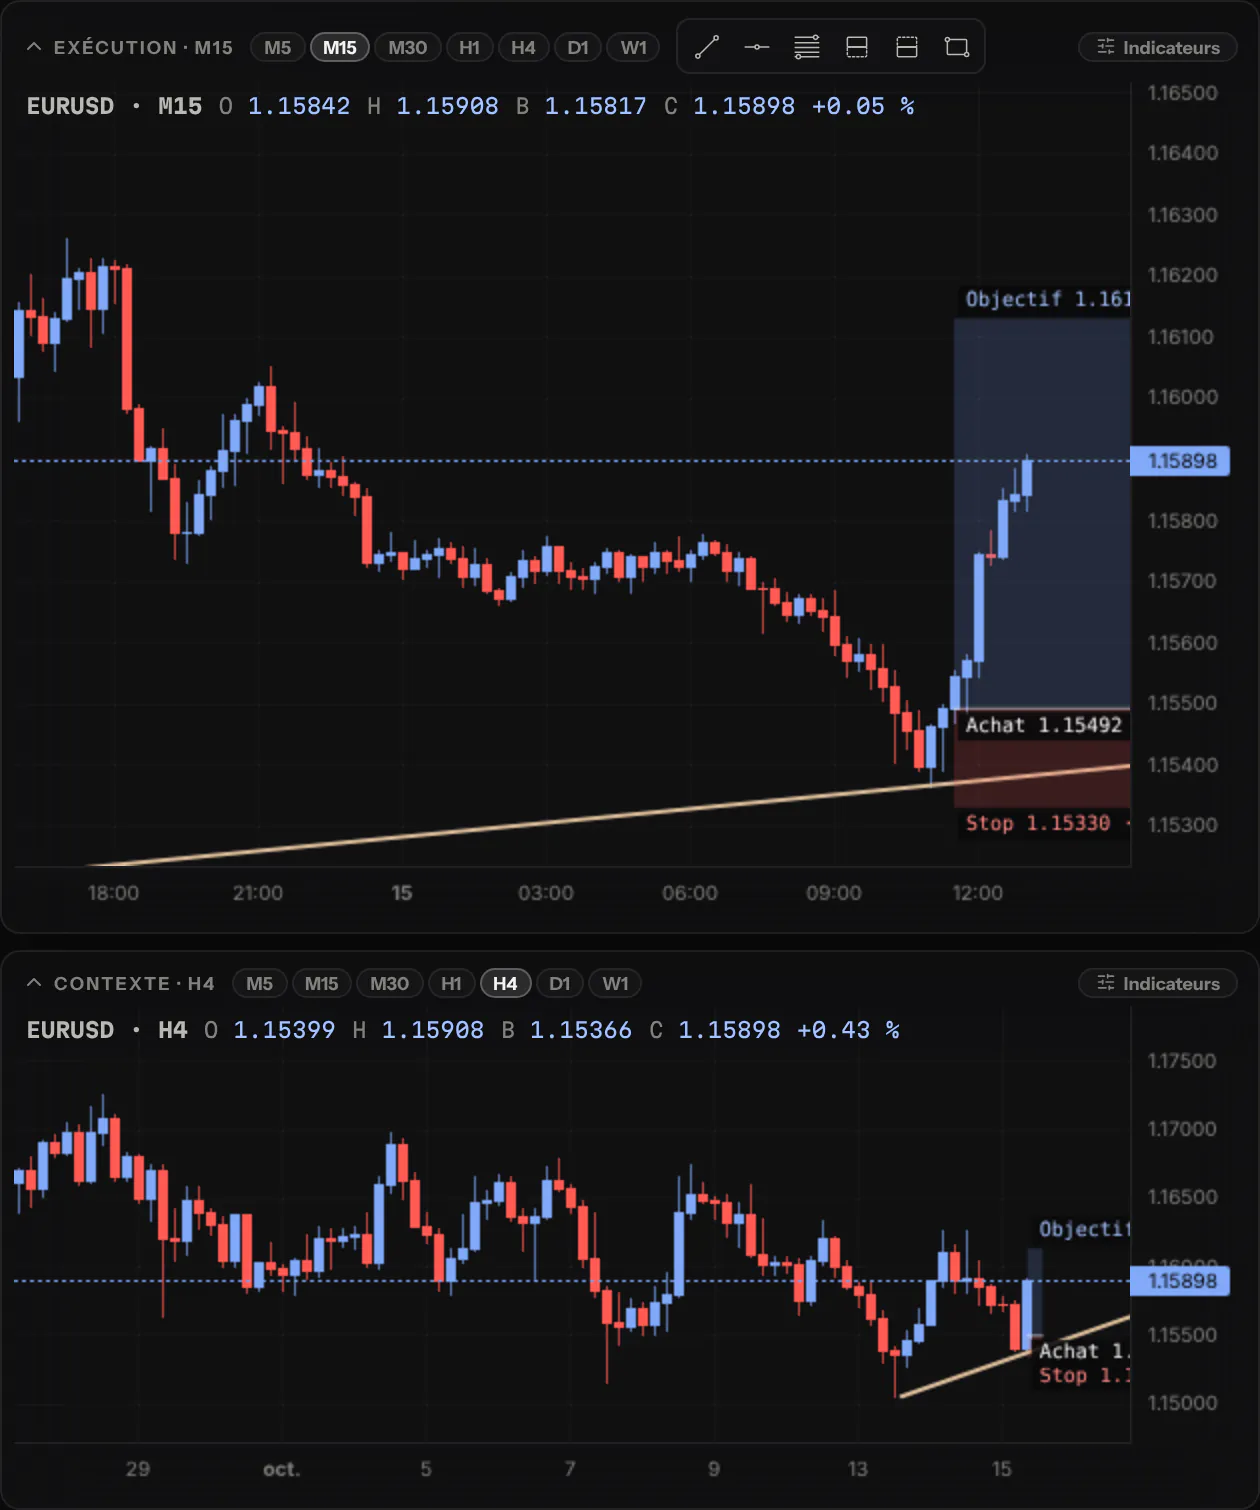
Choose.
A market, a timeframe, a date. History goes back about two months on M5 and M15, about two years on H1 and H4, and further on daily.
Draw and trade.
Candles are revealed one by one, from ×1 to ×16. Lines, channels, Fibonacci, long and short positions, indicators: position size follows your risk.
The context of the day.
The Macro panel (“panneau Macro”) shows scores, fundamentals, COT, calendar and analyses as they were known at the cursor: a result only appears at its own time.
04 / 05 · Test
A rule, tested without looking at the future.
Write it once, in plain words: “EMA 20 crosses above EMA 50”, “Prix est au-dessus de EMA 200” (price is above EMA 200), stop at 1.5 ATR, target at 2 R. Prisma tests it on historical data, the signal read at each candle’s close. If the stop and the target fall in the same candle, the stop counts; spread and commission are deducted.
Robustness: in-sample (build) against out-of-sample (control), by year or by month, by direction. Optimisation: one setting at a time, with the Contrôle (control) column alongside. Trades are poured into the journal with the “backtest auto” tag.
Buy whenEMA 20crosses aboveEMA 50·Priceis aboveEMA 200·stop1.5 ATR·target2R
Signal read at each candle close.
Expectancy · in-sample+0.31R
Expectancy · out-of-sample−0.04R

In-sample and out-of-sample (“Construction et contrôle”), side by side

A backtest dashboard
05 / 05 · Strategies
What each rule earns.
A strategy has its frame (markets, sessions, timeframes), its checklist with its mandatory rules, its risk and its targets. Prisma shows the expectancy when a rule is followed, and when it is not, across all your journals, live or backtest.
The frame
Markets, sessions, context and execution timeframes, direction.
The checklist
Rules for context, entry, management and exit, some of them mandatory.
The risk
Risk per trade, target R, maximum trades per day, daily loss not to be exceeded.
The targets
Target win rate and expectancy.
What a backtest does not know.
A backtest knows nothing of slippage, hesitation, or the temptation to cut too early. Prisma always keeps live and backtest apart, and an optimised setting is checked on the control period before it is believed.
Try it on a sample journal.
From the trial on, a sample journal is waiting for you: trades simulated on the real prices of the last eight weeks, with three strategies. Its results are simulated: they are not a performance.