
The method
Seven notions to read the market like a macro desk.
Each in three steps: what it measures, how to read it, where it fails. In the order a desk reads them: the backdrop, expectations, the surprise, the underlying trend, positioning, the shock, then the bias.
01 / 07 · The backdrop
What backdrop are we in?
What it measures
The regime places the economy on two axes: is growth accelerating or slowing, is inflation rising or ebbing. That gives four regimes — inflationary boom, stagflation, Goldilocks, deflation — and each favours certain assets. Prisma adds risk sentiment, and a question long taken for granted: can the central bank come to the rescue?
How to read it
The regime is read before choosing an instrument: the same technical signal does not give the same result in a disinflationary expansion and in an inflationary slowdown. Identifying the backdrop avoids applying a good method in the wrong one.
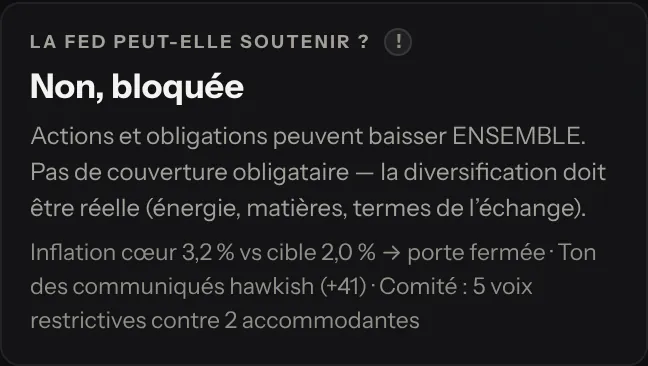
For a long time a shock was handled one way: equities fall, bonds rise, the central bank comes to the rescue. That assumes a central bank free to react to growth, so inflation contained enough for it to cut rates without contradicting itself. When that is no longer the case, a supply shock pushes inflation up against a bank that cannot respond: equities and bonds fall together, and the bond hedge disappears.
Where it fails
The verdict combines three readings: the inflation gap to target, the tone of statements and the dispersion of the committee. Its limit is openly acknowledged: the vote count reads public remarks, not official votes, and a member can speak firmly and then vote to hold. When inflation is missing, the verdict stays undetermined rather than guessed: a missing figure must never be read as an available backstop.
ReleaseUS inflation above consensus ↑
USD regimeGoldilocksInflationary boom
Can the central bank come to the rescue?Constrained
In Prisma
The Régime page: the growth × inflation quadrant, risk sentiment and the “Can the central bank come to the rescue?” indicator.
See the card in The terminal
Going further · chapter 2.6 « Les régimes de marché » of the course, free with an account (in French)
02 / 07 · Expectations
What is the market pricing for the next meeting?
What it measures
Rate expectations are read in prices. Short-term rate futures let you infer the probability of a cut, a hold or a hike at each meeting: if the contract implies a rate 16 basis points above the current one and a hike would be worth 25, the market is pricing about a 64 % chance of a hike. Prisma also shows Polymarket, where each meeting is split into mutually exclusive contracts (“25 bp cut”, “hold”, “25 bp hike”…): the price of each, between 0 and 1, reads as a probability.
How to read it
These are not opinions, they are money committed. And what informs is the move, not the level: seeing a probability go from 20 % to 60 % in three sessions says a release has changed the market’s mind.
The yield curve says the same over time. The central bank sets the short rate; the market sets the 10-year rate, which includes what it thinks about future rates. The slope between the two is a permanent vote on monetary policy: it flattens when the market doubts the current level will hold, and inverts when it prices cuts. Then there is language: a bank can change nothing and still move its currency with a mere hardening of wording, because the decision was expected and the tone was not.
Where it fails
Polymarket bets are those of individuals, sometimes for small amounts: a thin market can move on a single order, hence the value of comparing them with futures rather than reading them alone. Polymarket is banned for players in France: Prisma only shows its prices, collected by its server.
An inverted curve does not announce “a recession”: it says current policy is judged unsustainable, and the recession follows afterwards, when the bank cuts in the face of the slowdown. As for a statement’s tone score, it is an interpretation of text, not a measurement: it sheds light on the statement, it does not replace it.
+16 bp priced ÷ 25 bp ≈ 64%
todaya month ago
In Prisma
The Rates page: for each central bank, the current rate, the expected rate, probabilities by meeting, the implied curve, the committee’s bias and the statements.
See the card in The terminal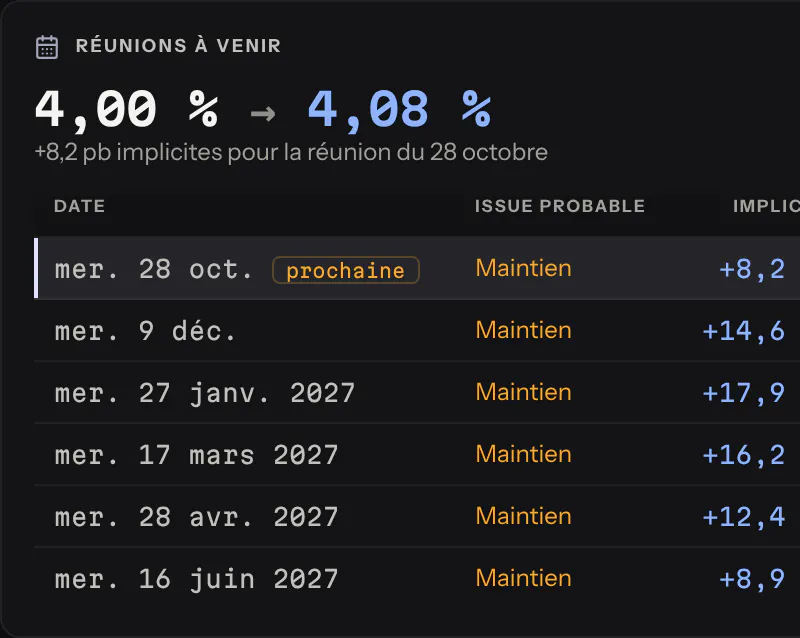
Going further · chapters 2.1 « Les banques centrales », 2.2 « Lire une décision de banque centrale » of the course, free with an account (in French)
03 / 07 · The surprise
Better or worse than expected?
What it measures
The consensus is the average of economists’ forecasts before the release, the actual is the real figure, and the gap between them is the surprise. It is what moves the price: the level of the figure is already in the market. The CESI accumulates these surprises over a rolling window. It does not say whether the economy is doing well, but whether it is doing better or worse than economists expected.
How to read it
Growth of 2 % is good news if 1.5 % was expected, bad news if 2.5 % was. The range of forecasts, from their minimum to their maximum, deserves a look: when it is wide, economists disagree and the reaction will be stronger whatever the result.
Since an exchange rate is a relative price, two economies are compared: the surprise differential isolates what matters. Two economies that disappoint equally produce no currency move; one that surprises while the other disappoints does.
Where it fails
The consensus adapts: a very high CESI announces its own fall, since economists raise their forecasts, and a CESI at its lowest prepares the opposite. Read it as a cycle, never as a trend. And many figures are republished corrected: a good release alongside a downward revision of the previous month is not a good release.
It remains to be seen whether the differential really explains the price. R² says so: 0 for no link, 1 for a perfect link, and in macro 0.3 is already notable. But a correlation is not a cause, and it is not stable: one that held for three years can vanish when the regime changes.
United StatesNon-farm payrolls
- Forecast
- 150k
- Range
- 95 – 210k
- Previous
- 142k
- Actual
- 254k
The level was expected. The surprise was not.
In Prisma
In Calendar, a release unfolds: consensus, range, previous figure (revised, it carries a ®) and official statement. In CESI, the surprise differential is read against the price, with its R².
See the card in The terminal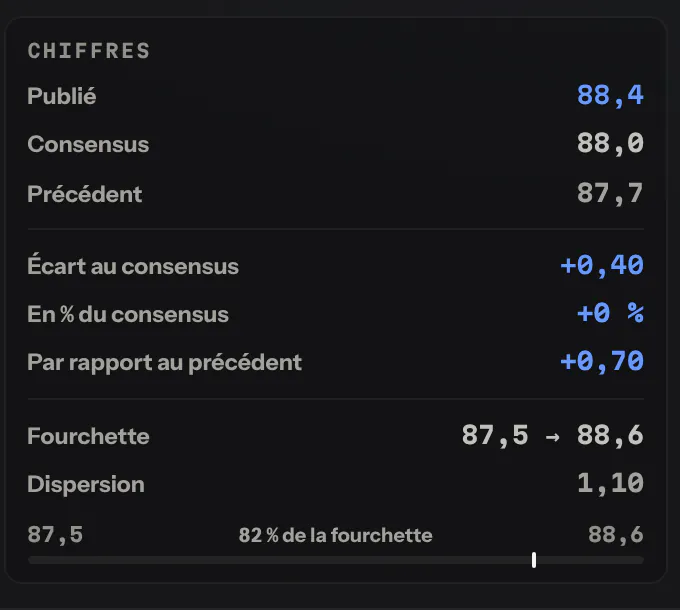

Going further · chapter 2.3 « Les indicateurs en détail » of the course, free with an account (in French)
04 / 07 · The underlying trend
Does the macro lean towards this currency?
What it measures
The PMSI is a single score per currency, computed from published macro data: inflation, growth, employment, confidence, trade, housing. It aggregates what is measured, not what is forecast. Two horizons coexist: Swing looks at the underlying trend over several months, moves slowly and gives the backdrop; Momentum looks at recent surprises, which fade with time, moves fast and gives the tempo.
How to read it
To compare two indicators, or two currencies, you normalise. A z-score answers “compared with its habit, is this figure extreme?”: it counts in standard deviations, 0 for a normal value, ±2 for a value rarely seen. A 0.3 % move is big on EUR/USD and means nothing on bitcoin; the same scale makes the comparison legitimate.
On the Macro page this logic shows: bright colour is reserved for moves at least 1.5 times larger than usual.
Where it fails
A score is not an order. It says which way the macro leans; the price can lean the other way for weeks, and that gap is precisely what is interesting. Three explanations are possible: the market anticipates what the macro has not yet recorded, another factor dominates (flows, politics, risk aversion), or the price is wrong. The first two are the most frequent: a divergence is documented before it is traded.
CPI ↑PMI ↑Jobs ↑Retail sales ↑
Momentumrecent surprises
Swingthe trend
Divergence That gap is what matters.
In Prisma
The Macro page: above the “Données macro” table, each currency’s PMSI score, in Swing or Momentum.
See the card in The terminal
Going further · chapter 2.3 « Les indicateurs en détail » of the course, free with an account (in French)
05 / 07 · Positioning
Who is already positioned, and how far?
What it measures
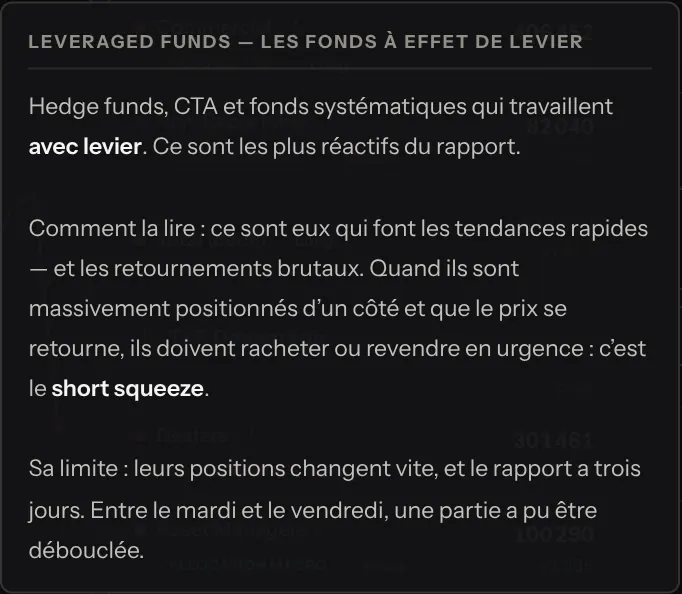
The COT report, published every week by the CFTC, says how many futures contracts each category of player holds: leveraged funds, asset managers, dealers, commercials. Prisma derives an index from it that places the current position within its range of the last three years. On the other side, retail sentiment: the share of buyers and sellers that brokers publish (here, OANDA). And options say where protection is being bought: implied volatility, skew, GEX, put/call ratio.
How to read it
What you look for is not the level but the extreme. When almost everyone is already positioned the same way, there are no buyers left to push the price higher: the position becomes a vulnerability, not a confirmation. Retail traders are read backwards: when 80 % of them are buyers, they have already bought, and their protective orders pile up just under the price.
On options, implied volatility is an insurance price, to be compared with its own past; skew says which side the market fears; GEX says whether market makers’ hedges dampen the move or amplify it; a very high put/call ratio signals fear already expressed, so already in the price.
Where it fails
Crowding measures fragility, not direction: it indicates the size of a possible reversal, never its date. The COT arrives late — data cut off on Tuesday, published on Friday, so at least three days old — and each category has its limit: an asset manager can be short dollars to hedge a portfolio of US equities, and a dealer does not bet on direction.
Retail sentiment is not an entry signal: it says a move the other way would be violent, not that it will happen. And for options on futures, the app reads a proxy ETF, which it flags on screen.
COT index · large speculators’ net position
3-year lowlast 4 weeks3-year high
Extreme: saturated position
Retail traders80% long
20% short↺ read it the other way round
In Prisma
The COT page (the three-year index, and an explanation of each player on hover) and the Sentiment page (buyers and sellers among retail traders, instrument by instrument).
See the card in The terminal

Going further · chapter 2.5 « COT, CESI & positionnement » of the course, free with an account (in French)
06 / 07 · The shock
Where is the risk, and which asset feels it?
What it measures
Geopolitical risk tracks the events likely to move capital towards safe havens: conflicts, elections, sanctions, trade tensions. In Prisma, World places them on a globe — news, prediction markets, the US fleet and Atlas notes — and its timeline strings the developments together.
How to read it
What matters is not an event’s gravity but its surprise. A risk announced months ago is already in the price; it is the unexpected that moves the Swiss franc, the yen and gold.
Where it fails
The same event does not have the same sign everywhere: a safe-haven premium supports a haven currency and weighs on the indices of exporting countries. Reading a shock therefore means asking which asset feels it, and in which direction, before asking whether it is serious.
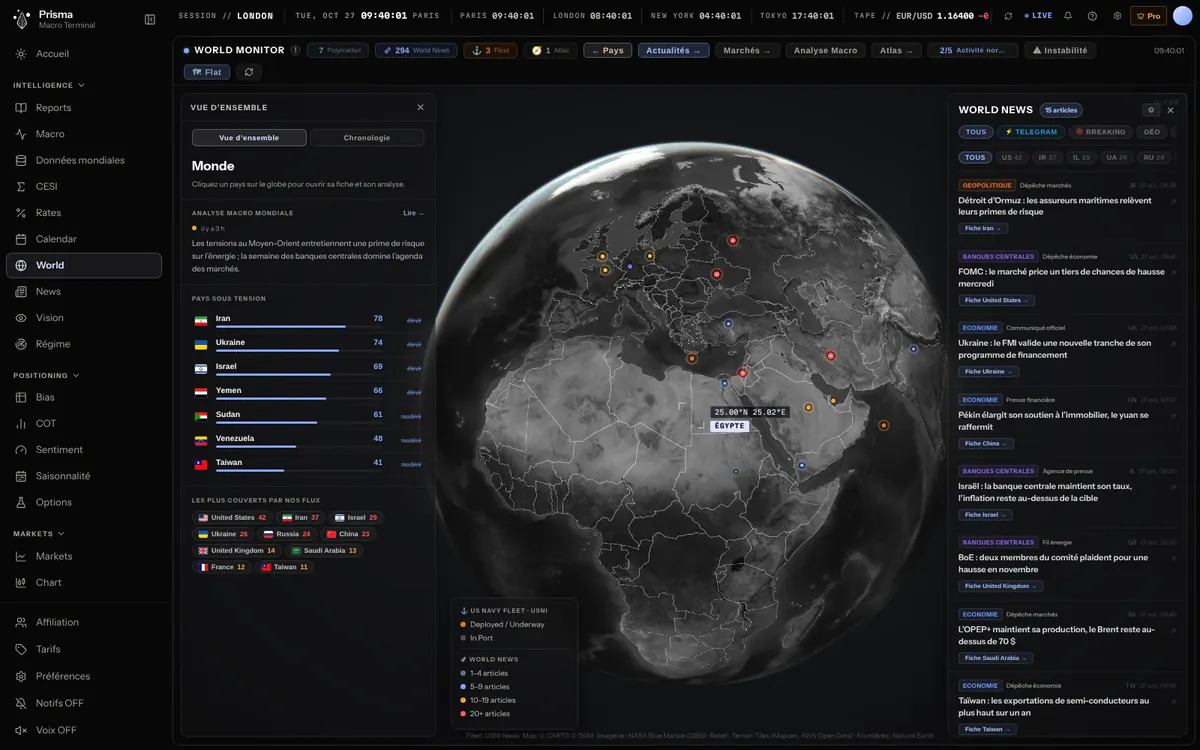 Simulated data
In Prisma
The World page: the left-hand panel sums up the global situation, and the Chronologie tab unrolls the developments day by day.
See the card in The terminal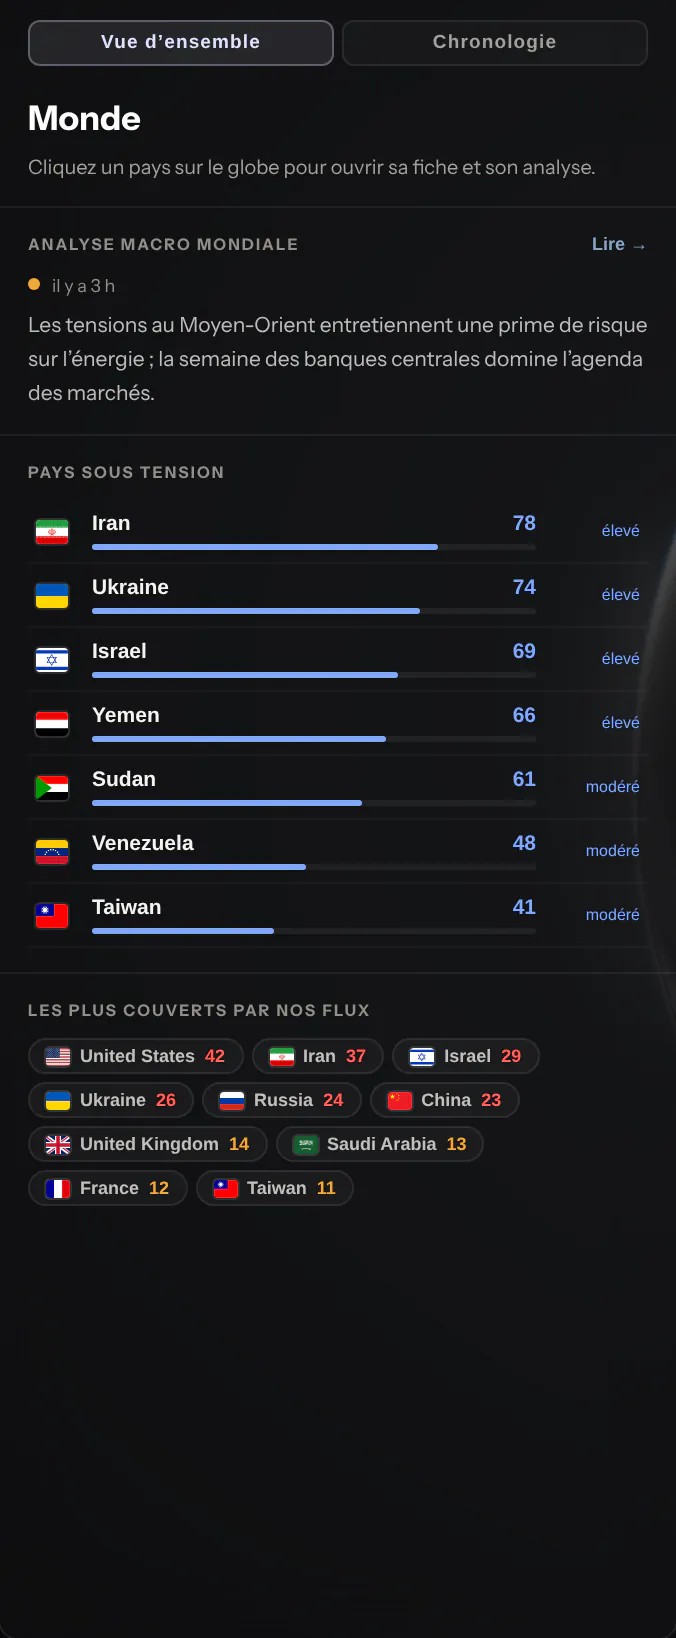
Going further · chapter 3.3 « Théâtres & transmission » of the course, free with an account (in French)
07 / 07 · The bias
How is a bias put together?
A bias is built, not guessed.
What it measures
A currency’s bias aggregates positioning, macro, surprises, rates, geopolitics and retail sentiment: six families of signals. It reads by pairs: a bullish bias on the euro and a bearish one on the yen points to EUR/JPY, not to the euro alone.
How to read it
The matrix shows one row per currency and one column per component; the conclusion draws a direction and a conviction from it. Conviction is not direction: it says how far the signals point the same way. The Visions then break the bias down by horizon: a pair can be bullish over three months and bearish over three days, and that is not a contradiction, they are two different questions.
Where it fails
A bias is not a recommendation: it is a starting point to check against the price, and the detail by horizon exists so that you can challenge the conclusion. A neutral currency is not without interest, it serves as a clean counterpart. And when a family of signals is missing, the score is recomputed on the others: the app says so, so that an incomplete gap is not read as a full one.
- Rates and central banks
- Geopolitics
- Macro
- Institutional positioning
- Economic surprises
- Retail, read contrarian
Euro+42
Dollar−18
+42 − (−18) = +60
EUR favoured
- SwingBullishConviction high
- MomentumBullishConviction medium
- IntradayBearishConviction low
A pair can lean both ways depending on the horizon.
Six families of signals.
Rates and central banks, geopolitics, macro, institutional positioning, economic surprises, and retail traders read as a contrarian signal: six families feed each currency’s score. When a family is missing, the score is computed on the others, and the app says so.
A pair is a gap.
EUR/USD reads as the gap between its two currencies: a euro at +42 against a dollar at −18 gives +60, and the Terminal shows “EUR favoured” (EUR favorisé).
One bias per horizon.
The same pair can be bullish over three months and bearish over three days: these are two different questions. Conviction is not direction; it says how far the signals point the same way.
In Prisma
The Terminal for an instrument sets a pair’s two currencies side by side, component by component; the Vision page gives each instrument’s bias over three horizons.
See the card in The terminal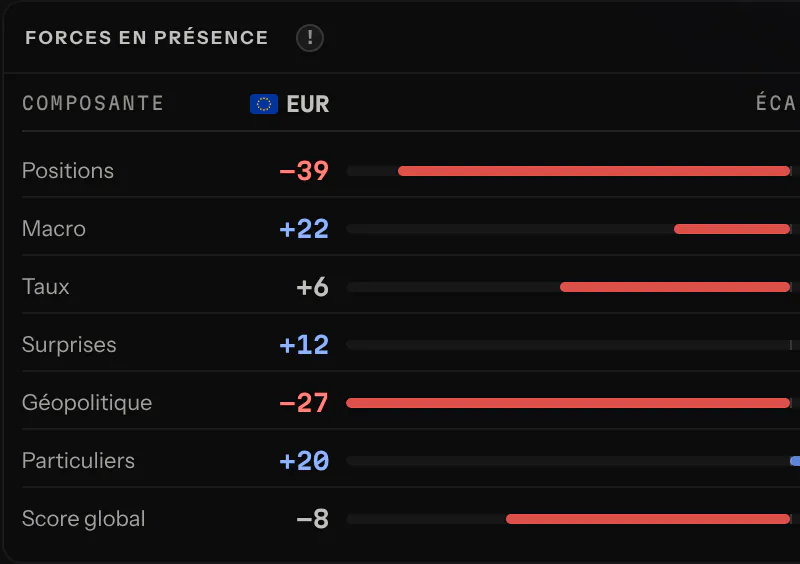

Going further · chapter S « Synthèse — La méthode de décision » of the course, free with an account (in French)
08 / 07 · The check
A bias is checked before it is traded: replay, backtest, journal.
Replay unveils candles one by one from a past date, never showing what comes next, with the macro context as it was known then. The backtest tests rules written once, each signal read at the close of its candle, with a check on a separate period. And the journal keeps the reason for every trade: without a written trace, you cannot know whether a gain came from the analysis or from luck.
Glossary
The Prisma glossary.
Every technical notion in the app carries a “?” badge that says what it measures, how to use it and where it fails. Here are the main ones, in a few sentences.
CESI — economic surprise index
It does not measure whether the economy is doing well, but whether it is doing better or worse than economists expected. Every release that beats the consensus pushes it up, every disappointment pushes it down, over a rolling window. Since the consensus adapts, a very high CESI announces its own fall: read it as a cycle, never as a trend.
Surprise differential
The difference between the CESI of two currencies. An exchange rate being a relative price, what matters is not an economy’s health but its gap with the other. Two economies that disappoint equally produce no currency move; one that surprises while the other disappoints does.
PMSI — Prisma macro score
A single score per currency, computed from published macro data: inflation, growth, employment, confidence, trade, housing. Swing gives the underlying trend over several months, Momentum the tempo of recent surprises. A score is not an order: it says which way the macro leans, and the price can lean the other way for weeks.
Z-score
It answers “compared with its habit, is this figure extreme?”. It counts in standard deviations: 0 for a normal value, ±2 for a value rarely seen. Normalising puts indicators and currencies on the same scale, which makes comparing them legitimate.
COT — positioning of the big players
The CFTC’s weekly report on the futures held by each category of player: leveraged funds (fast trends), asset managers (underlying trend), dealers (counterparty to their clients), commercials (hedging) and small holders (position inferred, to be read as a contrarian signal). What you look for is the extreme, not the level. The data is cut off on Tuesday and published on Friday: what you read is at least three days old.
Retail sentiment
The split between buyers and sellers among retail traders, as brokers publish it. It is read as a contrarian signal: when the great majority are buyers, they have already bought, and their protective orders pile up just under the price. It is not an entry signal, but information about crowding.
Crowding
How many participants are already on the same side. A crowded market stops rising for lack of buyers, and falls fast because everyone has the same exit. It is a measure of fragility, not direction: it indicates the size of a possible reversal, never its date.
STIR — what the market prices
Probabilities inferred from the price of short-term rate futures. If the contract implies a rate 16 bp above the current one and a hike would be worth 25, the market is pricing about a 64 % chance of a hike. What informs is the move, not the level.
Polymarket
A prediction market where each central bank meeting is split into mutually exclusive contracts (cut, hold, hike) whose price, between 0 and 1, reads as a probability. These are individuals’ bets, sometimes for small amounts: compare them with futures rather than reading them alone. Polymarket is banned for players in France: Prisma only shows its prices.
Yield curve
The central bank sets the short rate, the market sets the 10-year rate; the gap between them, the slope, is a permanent vote on monetary policy. A flattening slope says the market doubts the current level will hold; inverted, it prices cuts to come. An inversion does not announce “a recession”: it says current policy is judged unsustainable.
Bias matrix
The lean of each currency, aggregated from macro data, positioning and rates, with one row per currency and one column per component. It reads by pairs: a bullish bias on the euro and a bearish one on the yen points to EUR/JPY, not to the euro alone. A neutral currency is not without interest: it is a clean counterpart.
Macro / price divergence
The moments when the macro says one thing and the price does another. It is neither an error nor a signal: it is a question, with three possible answers — the market is anticipating, another factor dominates, or the price is wrong. A divergence is documented before it is traded.
Market regime
The backdrop in which everything else plays out, placed on two axes: is growth accelerating or slowing, is inflation rising or ebbing. It determines which assets work: the same technical signal does not give the same result from one regime to the next. Identify it before choosing an instrument.
“Can the central bank come to the rescue?”
A shock used to be handled by cutting rates; that assumes inflation contained enough for the central bank to be free to react to growth. When it no longer is, equities and bonds can fall together, with no bond hedge. The verdict combines the inflation gap to target, the tone of statements and the dispersion of the committee; when inflation is missing, it stays undetermined rather than guessed.
VIX — expected volatility
The volatility that options anticipate on the US index for the next thirty days: the market is calm when it is low, worried when it rises, coming apart when it soars. What informs is the change in level, not the level: a low VIX that climbs fast says far more than a high but stable one.
Consensus, actual, surprise
The consensus is the average of economists’ forecasts before the release, the actual is the real figure, and the gap between them is the surprise. It is what moves the price: the level of the figure is already in the market. A wide range of forecasts signals disagreement, so a stronger reaction whatever the result.
Revisions
Many figures are republished the following month, corrected. A good release alongside a downward revision of the previous month is not a good release. It is the most frequent misreading: the headline shows today’s figure, the market looks at the total.
PMI
A monthly survey of purchasing managers, for which 50 is the dividing line: above it activity is expanding, below it activity is shrinking. Its value is that it is early, since it comes out before official statistics. Its limit is that it is declarative: it measures what executives feel, not what they do.
Implied volatility
The move that the options market is charging for the coming weeks: it is not a forecast of direction, it is an insurance price. The more players fear a move, the more options cost. It is always compared with its own past: at its highest, part of the feared move has already been paid for.
Skew
The price gap between options that protect against a fall and those that bet on a rise. It says which side the market fears, which the level of volatility alone does not. A skew tilted heavily towards protection signals that the hedge has already been bought.
GEX — the effect of hedging on price
Market makers who sell options hedge by buying and selling the underlying, and GEX estimates the direction of those hedges. Positive, it dampens moves; negative, it amplifies them. It is information about how the market behaves, not about its direction.
Put / call ratio
The ratio between put and call options traded or held; above 1, more protection is traded than bullish bets. It is read as a contrarian signal at the extremes: a very high ratio signals fear already expressed, so already in the price. Between the extremes, it does not tell you much.
Visions
A lean for each instrument, broken down over several horizons: the same pair can be bullish over three months and bearish over three days, and these are two different questions. Conviction is not direction: it says how far the signals point the same way. It is not a recommendation, but a starting point to check against the price.
Geopolitical risk
A tracking of the events likely to move capital towards safe havens: conflicts, elections, sanctions, trade tensions. What matters is not gravity but surprise: a risk announced months ago is already in the price. The same event does not have the same sign everywhere, a safe-haven premium weighing on exporters’ indices.
A central bank’s tone (hawkish / dovish)
A reading of a statement’s language, not of the decision. Hawkish leans towards higher rates, or rates that stay high for longer; dovish, the opposite. This is often where the market’s reaction is decided, but it is an interpretation of text, not a measurement.
R² — strength of the relationship
The share of one series’ moves explained by the other: 0 for no link, 1 for a perfect link. In macro, an R² of 0.3 is already notable; above 0.7, you first wonder whether there is a mistake. A correlation is neither a cause nor stable.
Trading journal
The record of positions taken, with their reason: the tool that turns a series of trades into learning. Without a written trace of the why, you cannot know whether a gain came from the analysis or from luck. Backtest and live are kept apart, since they are not judged together.
Phased investment plan
An allocation that changes over time rather than a fixed split: each phase describes a period, its expected regime and the matching allocation. The point is to write decisions in cold blood. The figures in the scenarios are orders of magnitude, not forecasts.
The full course is free with an account.
41 chapters in PDF, each followed by a quiz, and an exam for each module: enough to go deeper into every notion on this page. The course is in French.